Methodology
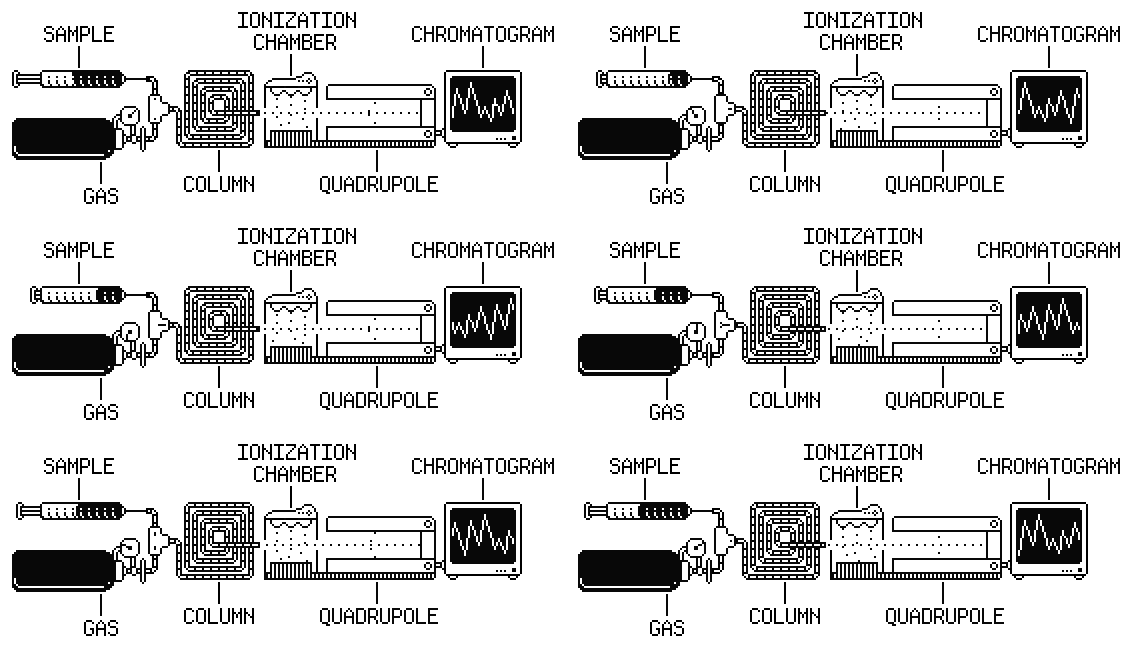
Table of contents
- Finding a lab
- Sampling protocol
- Sample collection, blinding, and shipping
- Chemical analysis
- Possible sources of low-level contamination in our samples
- Data analysis
- Costs
An important disclaimer: we have refrained from drawing high-confidence conclusions from these results, and we think that you should, too. Consider this a snapshot of our raw test results, suitable as a starting point and inspiration for further work, but not solid enough on its own to draw conclusions or make policy recommendations or even necessarily to alter your personal purchasing decisions. These results represent point-in-time results of a small number of product samples and may not be representative of actual product contents. These tests, like all tests, have inherent uncertainties, and different testing methodologies are likely to yield different results. And the existence of a chemical in a food doesn't necessarily imply a safety issue. We'd be thrilled to see serious efforts to replicate our results and we are open to any corrections you may have.
Finding a lab
We thought finding a lab would be easy, and in our initial enthusiasm, our goal was to send out samples for testing in the first week. In the end, it took us nearly 8 weeks to find a reliable lab that would work with us. We started with a list of more than 1,000 labs that do food testing. We called more than 100 of these and asked people in the field for their recommendations.
Many labs in the industry perform regular work for food companies themselves, and several such labs rejected us. Several turned down our money because we have no academic credentials. Many labs had no experience with the diversity of food items we wanted to test and couldn't convince our analytical chemist that they would produce accurate results due to a lack of quality control measures, transparency, or both. And some were too expensive or had months-long turnaround times. We found that many labs require NDAs that prevent clients from naming them, and this made it hard to get firsthand recommendations from the people who ran similar tests before.
We looked for a lab with experience testing the foods and the chemicals we wanted to measure. We reviewed their methods, making sure they had done similar work before and could develop new methods if needed. We checked their familiarity with our specific food types and target chemicals, how they handle testing challenges like interferences, and their quality control procedures.
We also made sure they could meet our hard openness requirement, allowing us to openly publish not only the results, but also the lab’s methodology for sample preparation, extraction, and analysis, as well as the blanks, standards, and QC materials they used. You can read our lab’s entire internal methodology.
We're very happy with the lab we found. And while we can't reveal their name, we can save you the trouble we went through: if you want to test foods, contact the fine people at Light Labs. They are building a new lab, have relationships with world-class established labs, and have experts who can assist you with the process. We worked with one of those established labs through Light Labs, and we happily recommend them. Light Labs became a sponsor for PlasticList, helping cover some of the testing costs. We couldn't have done this project without them.
Sampling protocol
We bought nearly all the samples directly from grocery stores and restaurants around the Bay Area. For the farm samples, we found nearby farms that service the Bay Area. The few samples ordered online were purchased from and delivered to the Bay Area. You can see where we collected each sample by checking the collected at field on the individual product pages.
We tested multiple samples of each product to capture the natural variation in chemical levels. For example, two bottles of the Fairlife protein shake might have slightly different levels of phthalates, even if they were made on the same day. To spot these differences, we bought up to 6 samples of each product. On average we tested 2.6 samples per product. If we tested a food with a different flavor or packaging material, we reported it as a separate product.
When we bought packaged samples, we make sure at least 3 of them had a unique combination of:
- Lot number (which tells us when it was made)
- Expiration date
- Store where we bought it
For instance, if we bought one bottle of Fairlife with lot number 1234, expiring on June 1, from Safeway in San Francisco, our next sample might have had the same lot number but come from a Whole Foods in Palo Alto. Or it might have had a different lot number and expiration date from the same Safeway. The key is that each sample had a unique combination of these three factors. This helped us get a true picture of what's in the product, not just what's in one batch or sold at one store.
For non-packaged samples (like Blue Bottle coffee), we collected from the same location on 3 different days. We reported samples from different locations as separate products.
There were two main exceptions to our sampling approach:
- Many fast food samples were collected on the same day, not on 3 different days.
- A small number of other products didn't fully meet the sourcing criteria above. For example, we might have had fewer than 3 samples, or one of the samples may have come in the same packaging but in a different size.
These exceptions don't make those results any less reliable; it just means we couldn't apply our extra sourcing steps to account for possible variation. And because we are sharing all the data, you will know exactly what we did for each product.
Sample collection, blinding, and shipping

Our goal was to standardize sample collection enough to avoid unnatural variance or contamination, while mimicking the way we all buy things in real life.
We sent the majority of samples in their original packaging, unopened. In grocery stores, we used metal shopping baskets; at the cashier, we packed samples in paper bags or, for perishable items, tried to place them in cooler bags with ice packs. When transporting, we placed the bags in the same part of the car each time, in an area where they are shaded from sunlight.
For non-packaged liquid items like tap water, we used two clean standardized 40ml glass vials provided by our lab. To prevent contamination, we avoided placing the lid open-side down on the counter, and screwed the lid back on as soon as we collected the sample.
For non-packaged solid items like broccoli or those in non-sealed packaging, such as strawberry containers or paper-wrapped steak, we needed a container that had no phthalates or bisphenols. We spoke with our lab and other groups who ran similar tests, and we learned that Ziploc bags were shown to have no phthalates or bisphenols and were widely used for sample collection. We decided to use Ziploc bags. We placed the sample into a Ziploc, sealed it as quickly as possible, then placed it into another sealed Ziploc for double protection. To make sure Ziplocs did not contaminate our samples, we saved blanks from the different Ziploc packages we used and shipped them to our lab for analysis. More on this below.
We wanted to prevent our lab from inadvertently introducing bias in the testing, and so we blinded the samples before shipping them to the lab. Therefore, laboratory personnel analyzed these samples without knowledge of the samples except what type of sample (water, broccoli, etc.) it was.
For each packaged sample, we either placed duct tape over the original labeling, removed the labeling entirely, or moved the sample from the original packaging into a standard glass vial or Ziploc bag. For non-packaged samples, we collected them directly into a standard glass vial or Ziploc bag.
We collected samples without gloves, using bare hands. As an extra precaution, when collecting non-packaged samples we washed our hands with unscented soap and avoided touching the sample or the opening of a container.
We tested the Ziplocs, the glass vials, and the hand soap for the same set of 18 chemicals. The glass vials showed no detected chemicals. The Ziploc bags, to our surprise, did show some phthalates at relatively low levels. More on this below. We also sent travel blanks – samples of hyperclean LC/MS-grade water shipped in a Ziploc bag and in a glass vial to test whether our containers leach chemicals into samples while traveling to the lab. Our travel blanks showed no detectable chemicals for either the Ziploc bag or for the glass vial sample.
After we blinded the samples, we shipped them to the lab as soon as we could – the same day, in most cases. We shipped samples overnight to minimize time in transit and hopefully limit exposure to factors we couldn't control, like the temperature in the shipping vehicle. We did not ship on Fridays, when UPS Overnight takes 3 days instead of 1, and so the few samples we purchased on Fridays had a few days between blinding and shipping. In those cases, we stored them in our office with 24/7 temperature control and restricted access. We stored perishable samples in a fridge or a freezer at the office.
We shipped the perishable samples in insulated cooler bags with ice packs, and the non-perishable samples in regular boxes with packing peanuts. When delivery by 10:30AM the next day was available, we chose that. When it wasn't available, we shipped overnight with delivery by 5PM next day. We used UPS to ship all the samples.
Chemical analysis
Who did the analyses of the samples?
We worked with one of the best labs in the world, with decades of experience analyzing chemicals in food, who asked not to be named due to their ongoing work with the food industry. They provided us with the raw data on analyzed samples: peak areas, calibration curves, sample weights, final extract volumes, and blank results. This made it possible for us to rerun the calculations ourselves end-to-end and make sure they were correct.
How did the lab analyze the samples?
Before starting analysis, the lab homogenizes some of the samples into uniform pulp with a blender or a cryomill. This ensures the chemicals are evenly distributed throughout the sample and lets the lab test complex foods, e.g. hamburgers, where different parts may have different contamination.
Surprisingly, the first thing the lab does after homogenizing is add phthalates and bisphenols to the samples. That sounds pretty counterintuitive — but the added phthalates and bisphenols are ‘labeled' with distinctive isotopes, either carbon-13 in place of carbon-12, or hydrogen-2 in place of hydrogen-1. These “labeled” compounds behave identically to the native phthalates and bisphenols in the food products until we get to the last step of the analysis, where the chemicals are separated by mass. At that point we can distinguish between them easily, and accurately measure the native compounds (if any) because they have different masses. The labeled compounds allow us to correct for any losses during extraction, and any variations in responses of the instruments. This approach, called isotope dilution mass spectrometry, is the gold standard of analysis.
The phthalates and bisphenols (both labeled and native) are then extracted from the samples with a solution of water and acetonitrile. The lab shakes the solution using sonication and leaves it overnight. The next day, they add some salt (magnesium sulfate) to clarify the samples, and separate them in a centrifuge. They then pull off a fixed amount from the clear upper layer. This layer is then evaporated to dryness until only a residual layer remains. When they are ready to analyze the sample, they add water and acetonitrile to the vial, shake, and centrifuge again. This extract now contains all the analytes, or the chemicals we're testing for, that used to be in our sample. It is ready for further analysis.
The next step is to separate the chemicals by injecting them into a chromatograph, so named because its early uses were to separate differently colored dyes. It separates chemicals by using a gas or liquid to push them through a tube coated with an exposed waxy layer (for phthalates) or filled with glass beads coated with a waxy material (for bisphenols). The time it takes for a given chemical to transit the tube depends on how attracted it is to the waxy layer, the chemical's polarity. The more attracted to the waxy layer, the slower a chemical will move through the tube. Even very similar chemicals will elute (emerge from the tube) at very different times given a long tube and the correct conditions. For example, diethyl phthalate and dibutyl phthalate have very similar structures, but the small difference between them leads to dibutyl eluting much later.
Once the phthalates and bisphenols are separated, the lab uses mass spectrometers connected to the end of the chromatograph to measure the amounts. The chemicals come out of the chromatograph at different times and enter the vacuum of the mass spectrometer, which knocks an electron off of them to form ions. Once the chemicals are ionized, magnetic and electric fields can move them around.
These ions move through a kind of oscillating curve using magnetic and electrical fields. Imagine racing a little Beetle against a big Escalade: the small car will whip around curves quickly, while the SUV will have to slow down. Similarly, heavier and lighter ions move at different speeds through the many curves generated using electromagnetic fields within a mass spectrometer. By adjusting those fields we can create different complicated curves for each ion to traverse, like a three-dimensional maze with moving walls, which only allow ions of a certain mass through at a time. This separates the labeled phthalates and bisphenols we added at the beginning from the native compounds already in the samples; their different masses mean they pass through the mass spectrometer under different electromagnetic conditions. After selection of the mass, the ions hit the detector and are detected when they steal an electron from the flow of electrons there.
Here is what raw data from the detector looks like:
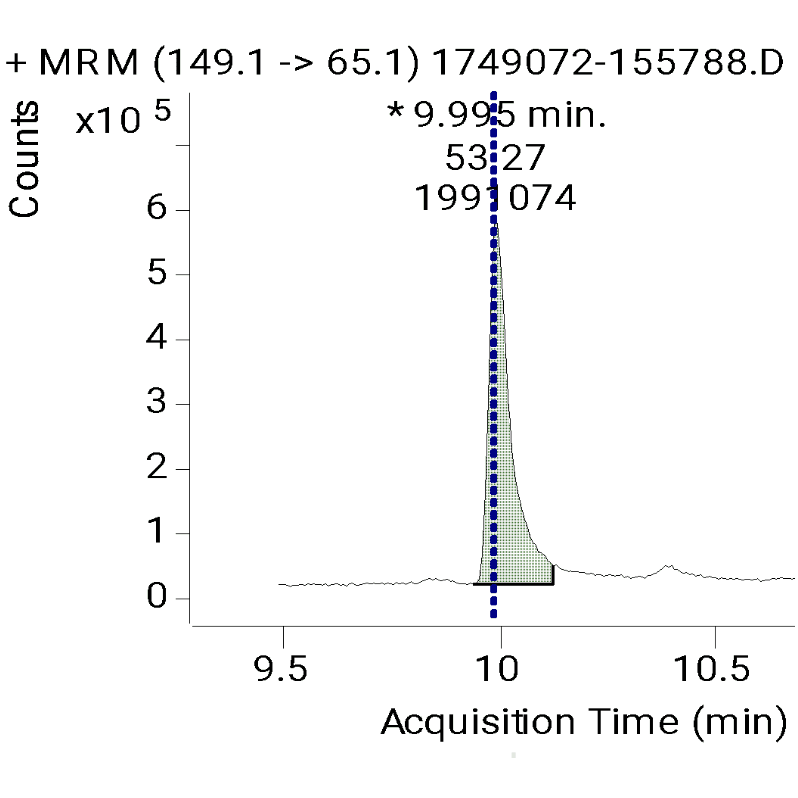
The chromatogram has time on the X axis and signal intensity on the Y axis. When an analyte elutes from the chromatograph column, there is a peak on this graph. The height of each peak corresponds to how much of that chemical is present, and the position of the peak along the time axis tells us which chemical it is, since each compound elutes at a characteristic time under given conditions.
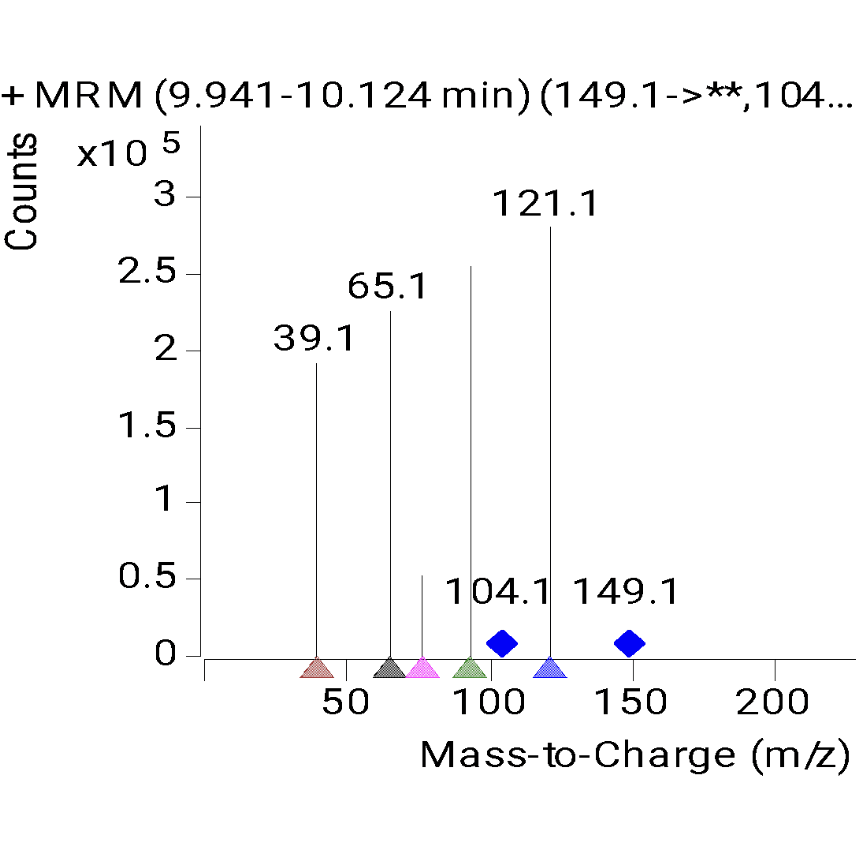
The mass spectra show mass-to-charge ratio (m/z) on the X axis and signal intensity on the Y axis. Each peak represents ions of a specific mass hitting the detector. The height of the peak indicates how many ions of that mass were detected. Native compounds and their labeled analogs appear as separate peaks because they have different masses, allowing the lab to measure them independently even if they eluted from the chromatograph at the same time.
For a deeper dive, see our lab's entire internal methodology.
What did the lab do to ensure the accuracy of the results?
In addition to isotope dilution mass spectrometry, our lab incorporated several additional steps to ensure the integrity of the results. They created batches of our samples and added several control samples to improve the reliability of the results. Here are the added materials, called quality control and assurance (QA/QC) samples, and why they were added to each batch:
- Water blanks: water samples spiked with labeled phthalates only, to measure the background levels of any chemicals in the instrumentation
- Reagent blanks: water samples that went through the same extraction steps as the samples, to ensure the solvents used to extract the samples had very low levels of the chemicals we are trying to measure
- Spiked blanks: water spiked with labeled and native chemicals, to ensure that the instrument was able to measure known amounts
- Spiked samples: our samples spiked with known levels of all analytes, to ensure nothing else in the sample affected the amount detected
- Standards: samples with known levels of all labeled and native chemicals, to ensure that the instrument was responding appropriately and allowing us to calculate the actual levels
If any of the QA/QC samples did not meet the lab's acceptable variance, the samples were reanalyzed. In samples with very high levels, the samples were diluted so that their levels fell into the levels of the standards and the final result was corrected for that dilution.
In addition to the QA/QC samples added to each batch, the lab used a method that allowed for further state-of-the-art data checks using the mass spectrometer itself. Some mass spectrometers, known as “triple quadrupole” mass spectrometers, have a second stage, called a “collision cell”, which shatters the previously mass-selected ions by accelerating them into a wall of argon atoms. (If you accelerate anything fast enough, even argon gas acts like a brick wall.)
Why go to all the effort of selecting a specific ion with a specific mass, only to destroy it by smashing it into a wall of argon? Well, under controlled conditions, molecules shatter in specific predictable ways. This allows us to do two things: 1) monitor one of the fragments to add selectivity and quantify the amount in the original sample and 2) monitor several fragments to confirm the identity of our ion. If the ratios of the extra ions, known as “confirmation ions”, do not match the specific chemical that we think we are measuring, we know there was an interference that made it through the whole process. It's a kind of molecular fingerprinting: if the fingerprint does not match, the ion was not the one we were looking for. When it comes to eliminating interferences, this technique is as good as it gets.
Possible sources of low-level contamination in our samples
Many of the chemicals we tested are present in every part of our environment: in the air, in the water, in our clothing, in our cars. We were careful to avoid contamination wherever we could, but there are two sources of possible contamination we wanted to mention: ziploc bags and hand soap.
Ziploc bags contain phthalates
Ziploc bags prominently advertise that they are made without BPA or phthalates.
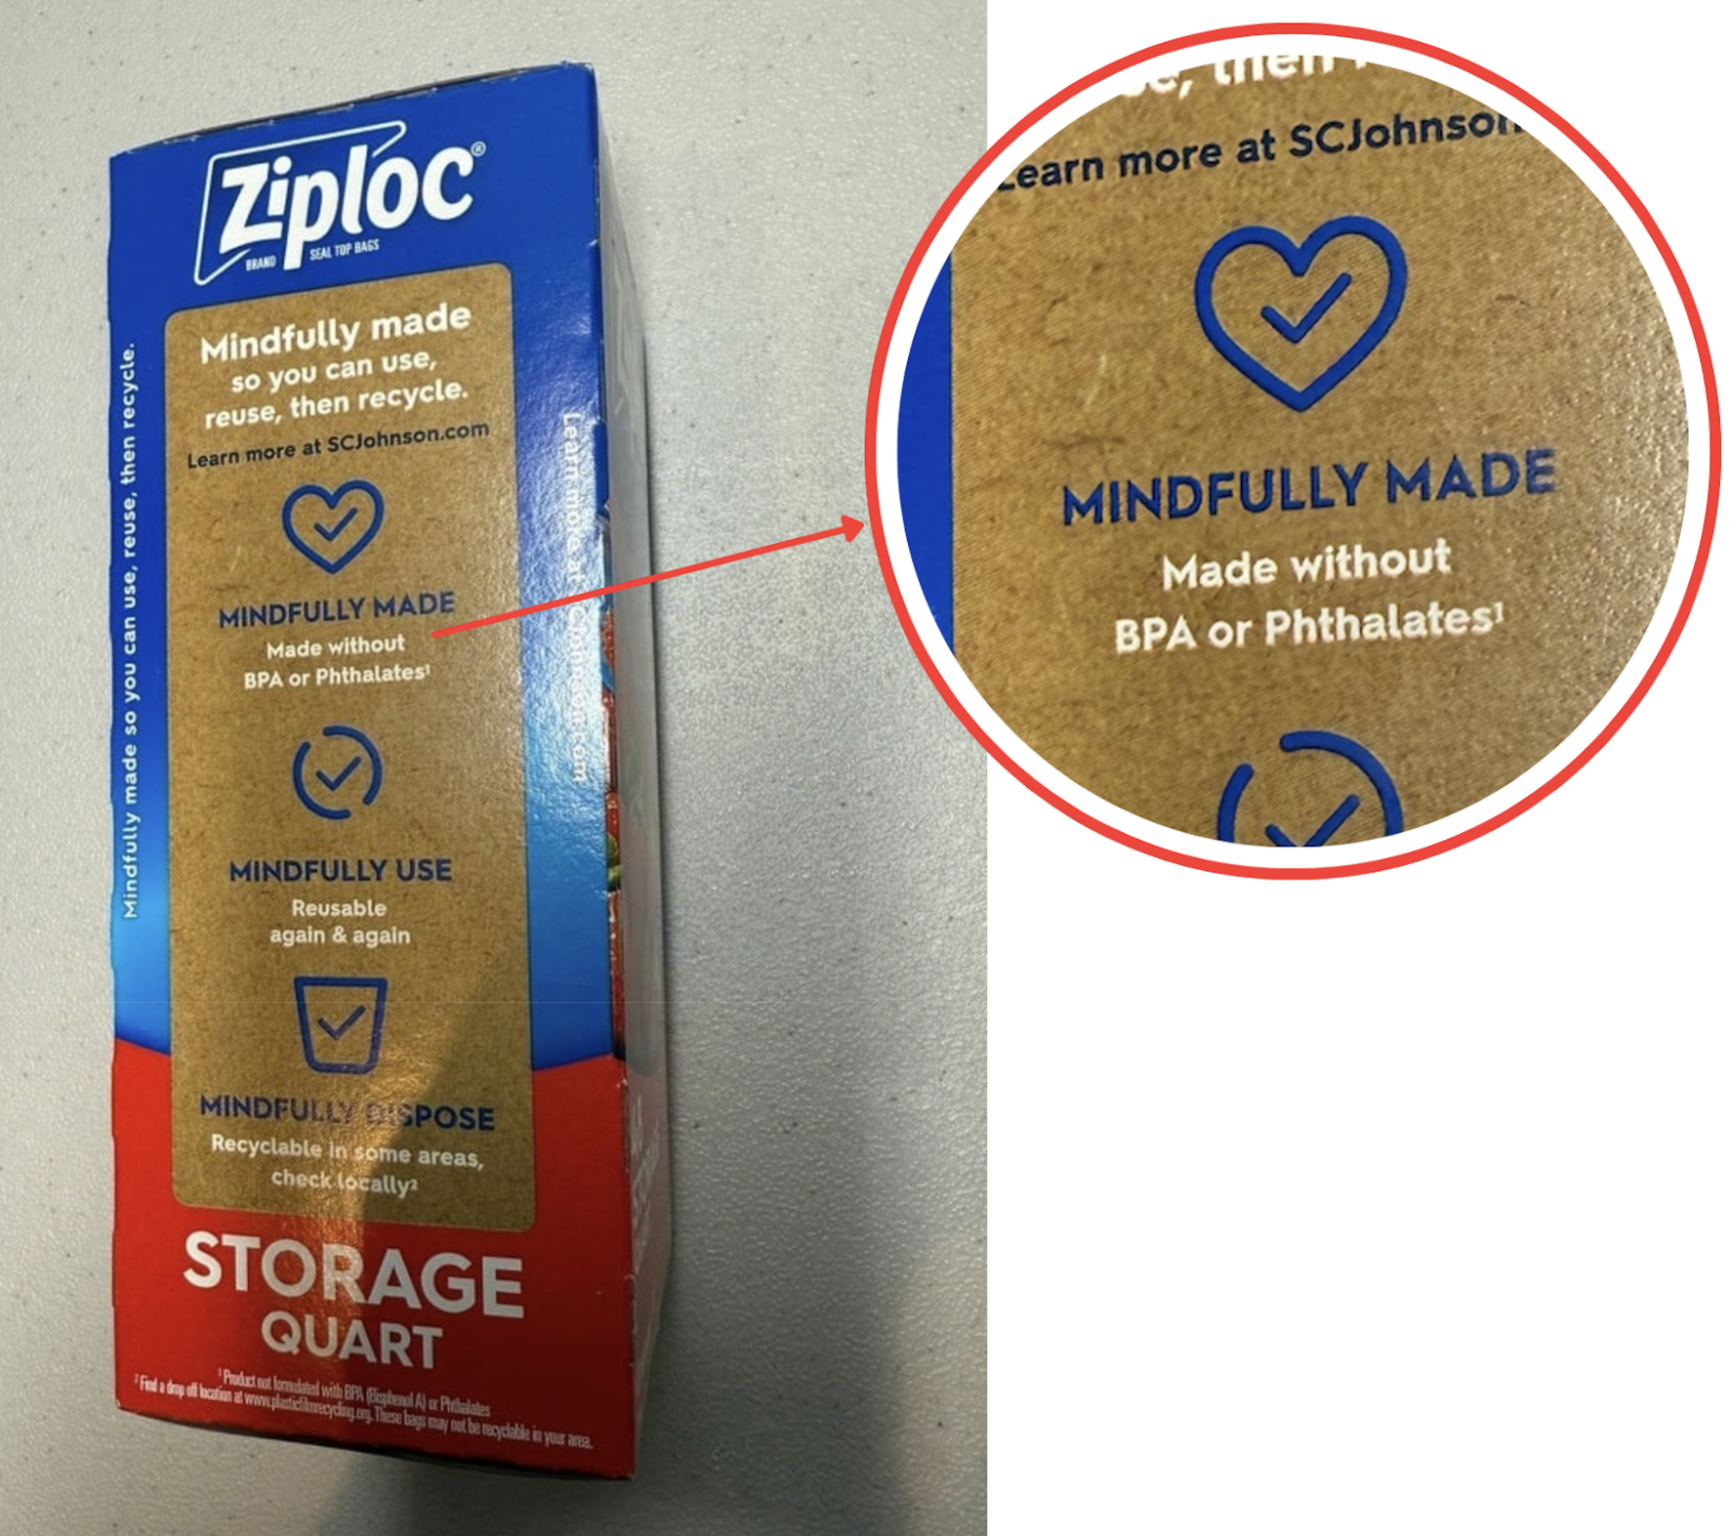
Perhaps for this reason, they have a reputation for being safe sample containers in the food testing community. In fact, Consumer Reports, who have done excellent work on food testing, used Ziploc bags for their phthalate and bisphenol report:
Each sample was masked, blind coded, and shipped to an independent, accredited laboratory for bisphenols and phthalates analyses. Where necessary, perishable samples were transferred into brown high-density polyethylene or HDPE jars or Ziploc bags and frozen before shipment to the lab. Empty samples of the HDPE jars and Ziploc bags were also shipped to the lab for analysis as controls. At the labs, sample preparation was performed in fume hoods verified to be free from bisphenols or phthalate contamination. Water, sample containers, and other materials used for the analyses were monitored for contamination to account for any biases in sample results.
And this reflects what many of the labs seem to believe, as well. Here's what one very reputable and careful lab told us:
For food samples, Ziploc bags can be used for the test portions that are taken out of the wrappers/containers. We have done studies where clients have purchased a hamburger or burrito for example, removed the wrapper, placed in a Ziploc bag, and labeled accordingly. If you go that route I would suggest gallon sized bags and double bag before sending. Also include at least two empty Ziploc bags, which we will test as blanks. We have shown they are free (negligible levels if any) of the analytes of interests for your study
So, following in the footsteps of Consumer Reports and others, we used Ziploc bags to transport 26% of our food samples. We also had the bags themselves tested. They were free of bisphenols, but to our surprise, we did find phthalates in them:
| Sample ID | Product | DEHP ng/in2 | DBP ng/in2 | BBP ng/in2 | DINP ng/in2 | DIDP ng/in2 | DEP ng/in2 | DMP ng/in2 | DIBP ng/in2 | DNHP ng/in2 | DCHP ng/in2 | DNOP ng/in2 | DEHT ng/in2 | DEHA ng/in2 | DINCH ng/in2 | DIDA ng/in2 | BPA ng/in2 | BPS ng/in2 | BPF ng/in2 |
|---|---|---|---|---|---|---|---|---|---|---|---|---|---|---|---|---|---|---|---|
| 8144301 | Container blank: Ziploc Storage Bag | 62 | 70 | 8 | <1 | 38 | 31 | 28 | 25 | 0.1 | <1 | <1 | 250 | 17 | <1 | <10 | <1 | <1 | <1 |
| 8144303 | Container blank: Ziploc Storage Bag | 19 | 41 | 4 | <1 | <10 | 8 | 22 | 13 | 0.1 | <1 | <1 | 81 | 131 | <1 | <10 | <1 | <1 | <1 |
| 8144305 | Container blank: Ziploc Storage Bag | 36 | 101 | 13 | <1 | <10 | 33 | 17 | 30 | <1 | <1 | <1 | 267 | 30 | <1 | <10 | <1 | <1 | <1 |
| 8144306 | Container blank: Ziploc Storage Bag | 25 | 58 | 6 | <1 | <10 | 28 | 5 | 24 | <1 | <1 | <1 | 151 | 17 | <1 | <10 | <1 | <1 | <1 |
| 8144307 | Container blank: Ziploc Storage Bag | 15 | 54 | 6 | <1 | <10 | 14 | 18 | 17 | 0.2 | <1 | <1 | 78 | 19 | <1 | <10 | <1 | <1 | <1 |
| 8144308 | Container blank: Ziploc Storage Bag | 25 | 95 | 13 | <1 | 15 | 16 | 34 | 29 | 0.3 | <1 | <1 | 204 | 24 | <1 | <10 | <1 | <1 | <1 |
| 8144309 | Container blank: Ziploc Storage Bag | 24 | 56 | 6 | <1 | <10 | 28 | 4 | 25 | <1 | <1 | <1 | 528 | 16 | <1 | <10 | <1 | <1 | <1 |
| 8144310 | Container blank: Ziploc Storage Bag | 23 | 52 | 6 | <1 | <10 | 24 | 4 | 19 | <1 | <1 | <1 | 602 | 15 | <1 | <10 | <1 | <1 | <1 |
| 8144311 | Container blank: Ziploc Storage Bag | 19 | 53 | 6 | <1 | <10 | 27 | 5 | 23 | <1 | <1 | <1 | 265 | 9 | <1 | <10 | <1 | <1 | <1 |
| 8144312 | Container blank: Ziploc Storage Bag | 35 | 97 | 12 | <1 | <10 | 51 | 31 | 39 | 0.2 | <1 | <1 | 244 | 54 | <1 | <10 | <1 | <1 | <1 |
| 8144313 | Container blank: Ziploc Storage Bag | 51 | 109 | 26 | <1 | 26 | 66 | 21 | 42 | 0.4 | <1 | <1 | 324 | 59 | <1 | <10 | <1 | <1 | <1 |
| 8144314 | Container blank: Ziploc Storage Bag | 29 | 44 | 6 | <1 | <10 | 10 | 19 | 15 | 0.1 | <1 | <1 | 95 | 179 | <1 | <10 | <1 | <1 | <1 |
| 8144315 | Container blank: Ziploc Storage Bag | 35 | 68 | 10 | <1 | <10 | 26 | 8 | 23 | <1 | <1 | <1 | 757 | 48 | <1 | <10 | <1 | <1 | <1 |
| 8144316 | Container blank: Ziploc Storage Bag | 26 | 66 | 8 | <1 | <10 | 27 | 9 | 24 | <1 | <1 | <1 | 124 | 36 | <1 | <10 | <1 | <1 | <1 |
| 8144317 | Container blank: Ziploc Storage Bag | 25 | 65 | 7 | <1 | <10 | 29 | 11 | 25 | 0.2 | <1 | <1 | 120 | 36 | <1 | <10 | <1 | <1 | <1 |
| 8144318 | Container blank: Ziploc Storage Bag | 39 | 75 | 17 | <1 | <10 | 35 | 15 | 27 | 0.2 | <1 | <1 | 241 | 35 | <1 | <10 | <1 | <1 | <1 |
| 9050103 | Travel blank: Ziploc Bag with LC/MS-Grade Water | <10 | <10 | <5 | <1 | <100 | 27 | 9 | <10 | <1 | <10 | <1 | <50 | <10 | <1 | <100 | <1 | <1 | <1 |
Does this mean the Ziploc bags contaminated our samples? Not necessarily. We also tested a travel blank in a Ziploc bag, and it showed very small amounts of contamination for only two phthalates, DMP and DEP, at 9 ng/in2 and 27 ng/in2 respectively. There was no contamination shown in the travel blank for any of the other 18 analytes.
Furthermore, to extract the phthalates from the Ziploc bags, the lab used acetonitrile, which is a solvent that extracts phthalates especially well. Our lab filled the Ziplocs with acetonitrile for 16 hours and then tested the acetonitrile – quite a different process from simply placing food in them and transporting it. However, it does mean that our samples tagged ‘ziploc' may have undergone a small amount of phthalate leaching from the bags, especially if the food was fatty and hot at the time it was placed in the ziploc.
These phthalate levels are so low, we don't think this is a serious concern about our study, but we found this result surprising, so we wanted to be transparent about it.
Plus, our lab accidentally tested a few Ziploc bags from the same box, and we were surprised to see that in one of the boxes, DEHT level for Ziploc 8144318 was a whole 3.14x lower than for its box-brother Ziploc 8144315. So you never really know how much phthalates were in the exact bag you used.
You will also find it reassuring to know that most of our samples were not shipped in Ziploc, but in sterilized/standardized glass vials, which were tested clean of all analytes:
| Sample ID | Product | DEHP ng/g | DBP ng/g | BBP ng/g | DINP ng/g | DIDP ng/g | DEP ng/g | DMP ng/g | DIBP ng/g | DNHP ng/g | DCHP ng/g | DNOP ng/g | DEHT ng/g | DEHA ng/g | DINCH ng/g | DIDA ng/g | BPA ng/g | BPS ng/g | BPF ng/g |
|---|---|---|---|---|---|---|---|---|---|---|---|---|---|---|---|---|---|---|---|
| 11042401 | Container blank: Glass Vial | <14 | <14 | <7 | <1 | <140 | <14 | <7 | <14 | <1 | <14 | <1 | <72 | <14 | <1 | <140 | <7 | <7 | <7 |
| 11042402 | Container blank: Glass Vial | <14 | <14 | <7 | <1 | <140 | <14 | <7 | <14 | <1 | <14 | <1 | <72 | <14 | <1 | <140 | <7 | <7 | <7 |
| 11042403 | Container blank: Glass Vial | <14 | <14 | <7 | <1 | <140 | <14 | <7 | <14 | <1 | <14 | <1 | <72 | <14 | <1 | <140 | <7 | <7 | <7 |
| 9050102 | Travel bank: Glass Vial with LC/MS-Grade Water | <10 | <10 | <5 | <1 | <100 | <10 | <5 | <10 | <1 | <10 | <1 | <50 | <10 | <1 | <100 | <1 | <1 | <1 |
Our unscented hand soap contained some phthalates
We used an unscented hand soap to wash our hands before handling samples. We thought we picked one that would be free of plastic chemicals, but we tested it and found very low levels of two of our analytes:
| Sample ID | Product | DEHP (ng/wash) | DMP (ng/wash) |
|---|---|---|---|
| 8144401 | Seventh Generation Free & Clean Fragrance-Free Handwash | 44 | 126 |
| 8154401 | Seventh Generation Free & Clean Fragrance-Free Handwash | 48 | 140 |
| 8154402 | Seventh Generation Free & Clean Fragrance-Free Handwash | 56 | 120 |
Data analysis
Estimating serving sizes
Our goal with serving sizes is to provide a useful and consistent unit of measurement for the consumption of plastic chemicals. Since in many cases serving size data differs depending on the source, we used the following approach:
For packaged foods, we preferred the nutrition label on the package as the source of truth.
For non-packaged goods, we used a common unit of measurement – 1 slice for bread, 1 cup for berries and vegetables, and so on. To get the weight in grams, we looked at nutritionix.com. The Nutritionix database compiles nutrition data from grocery brands and restaurant chains. They took the USDA database and expanded it with hand-curated data. They staff a team of registered dietitians to verify each data entry and update grocery items regularly.
We leaned towards keeping the serving sizes consistent for similar products. For example, even though nutritionix has a special entry for Boudin Sourdough Bread, we used their generic Sourdough Bread entry and applied it to all sourdough bread samples. As another example, we kept the serving size consistent for all the samples of Ghirardelli Intense Dark 72% Cacao Dark Chocolate, even though the version in paper packaging reported a serving size of 25 grams, and the same product in plastic packaging reported the serving size of 32 g. We did not standardize the serving size in cases where similar products may significantly differ in serving size weight, like with cheeseburgers, and where strict dosage is required, like with supplements.
We also published the data in nanograms per gram, so you can find the concentration of plastic chemicals in servings of any size.
Treating results below LOQ
87% of PlasticList test results came back as “<LOQ” – below the limit of quantification.
Limits of quantification are the lowest levels that the lab could measure accurately. LOQs tell us how low we can measure before natural background variation makes results unreliable. (Technically, instrument sensitivity also sets a lower boundary for measurement, but modern instruments are so sensitive that it's usually the variation in background contamination that determines the limit.) LOQs vary by chemical and sometimes even for the same chemical between testing days, so our lab carefully monitored background levels and reanalyzed batches when needed. In the Results table, you'll see grayed-out values such as “<100” – this means the LOQ is set to 100, and the true amount is between 0 and 99.
Throughout our work, when computing aggregate values, we had to decide how to treat <LOQ results. Omitting them would skew the variation down: for example, if our results were [15, 10, and <10], omitting <10 would guarantee to make the average higher than it really was. At the same time, we didn't know the real value of <LOQ results.
So, here is how we treated <LOQ results: we checked if, for this product and this analyte, any samples had a detected level >LOQ. If at least 1 of the product's samples was >LOQ for this analyte, we treated <LOQ values as LOQ / 2 – halfway between zero and LOQ. If all the samples were <LOQ, we treated them as 0. This let us make use of the information encoded in <LOQ results (that a result is below the LOQ value) while avoiding overrelying on uncertain values.
Estimating variation between samples
Relative Percent Difference (RPD) is used in analytical chemistry to find the difference in results between two samples: RPD = |A - B| / (|A + B| / 2) × 100.
For each product, we went through each analyte result and found the RPD between each pair of samples. We took the mean of all the RPDs to get the average variation.
Costs
The total cost of the project was about $500k. Our tests cost a few hundred dollars per sample and made up nearly $300k of our total budget. We spent over $150k on salaries and expert advice. Food samples, materials, gas, shipping, and legal fees made up the rest of our costs.
Project costs were covered by donations from Nat Friedman, Light Labs, Patrick and John Collison, and Fred Ehrsam. Thanks to our sponsors for their support!